Product Design
M365D Threat Analytics
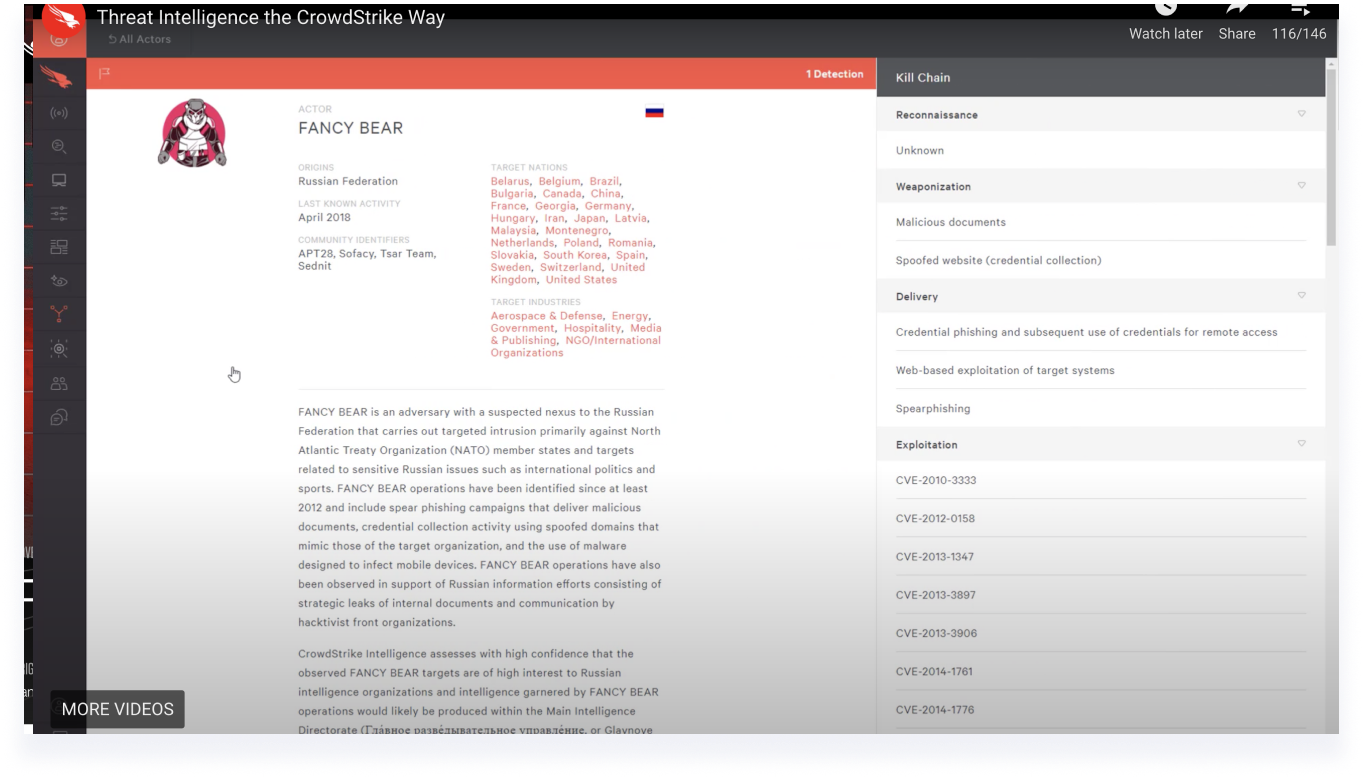
Microsoft Defender’s Threat analytics is a threat intelligence product, providing users knowledge from expert Microsoft security researchers. It's designed to assist security teams to be as efficient as possible while facing emerging threats and gain awareness about active threat actor campaigns, popular and new threat techniques, critical vulnerabilities, and more.
Besides serving as an all-round security knowledge center, it also has the goal of connecting security teams with other integral risks and vulnerabilities within the product to better protect their organization. In my role as the lead Product Designer on this feature, there were two main phases which included different product and engineering teams as well as roll out timings.
Goals - Phase I
Goals - Phase I
- Improve threat campaign report usability
- Connect to other product areas that show risk and vulnerabilities for better investigation and configuration efforts
- Present an aggregated view of relevant organization threats
Research
The initial research included a wide competitive landscape understanding with the collaboration of product managers to see which features are missing and what Microsoft can bring in terms of threat intelligence that other competitors don’t have.
I also conducted user interviews to understand the various security personas and their day-to-day insight into the threat landscape.
One of the main take-aways was Microsoft’s threat intelligence data advantage and the ability to connect the threat report to other risk factors within the product.

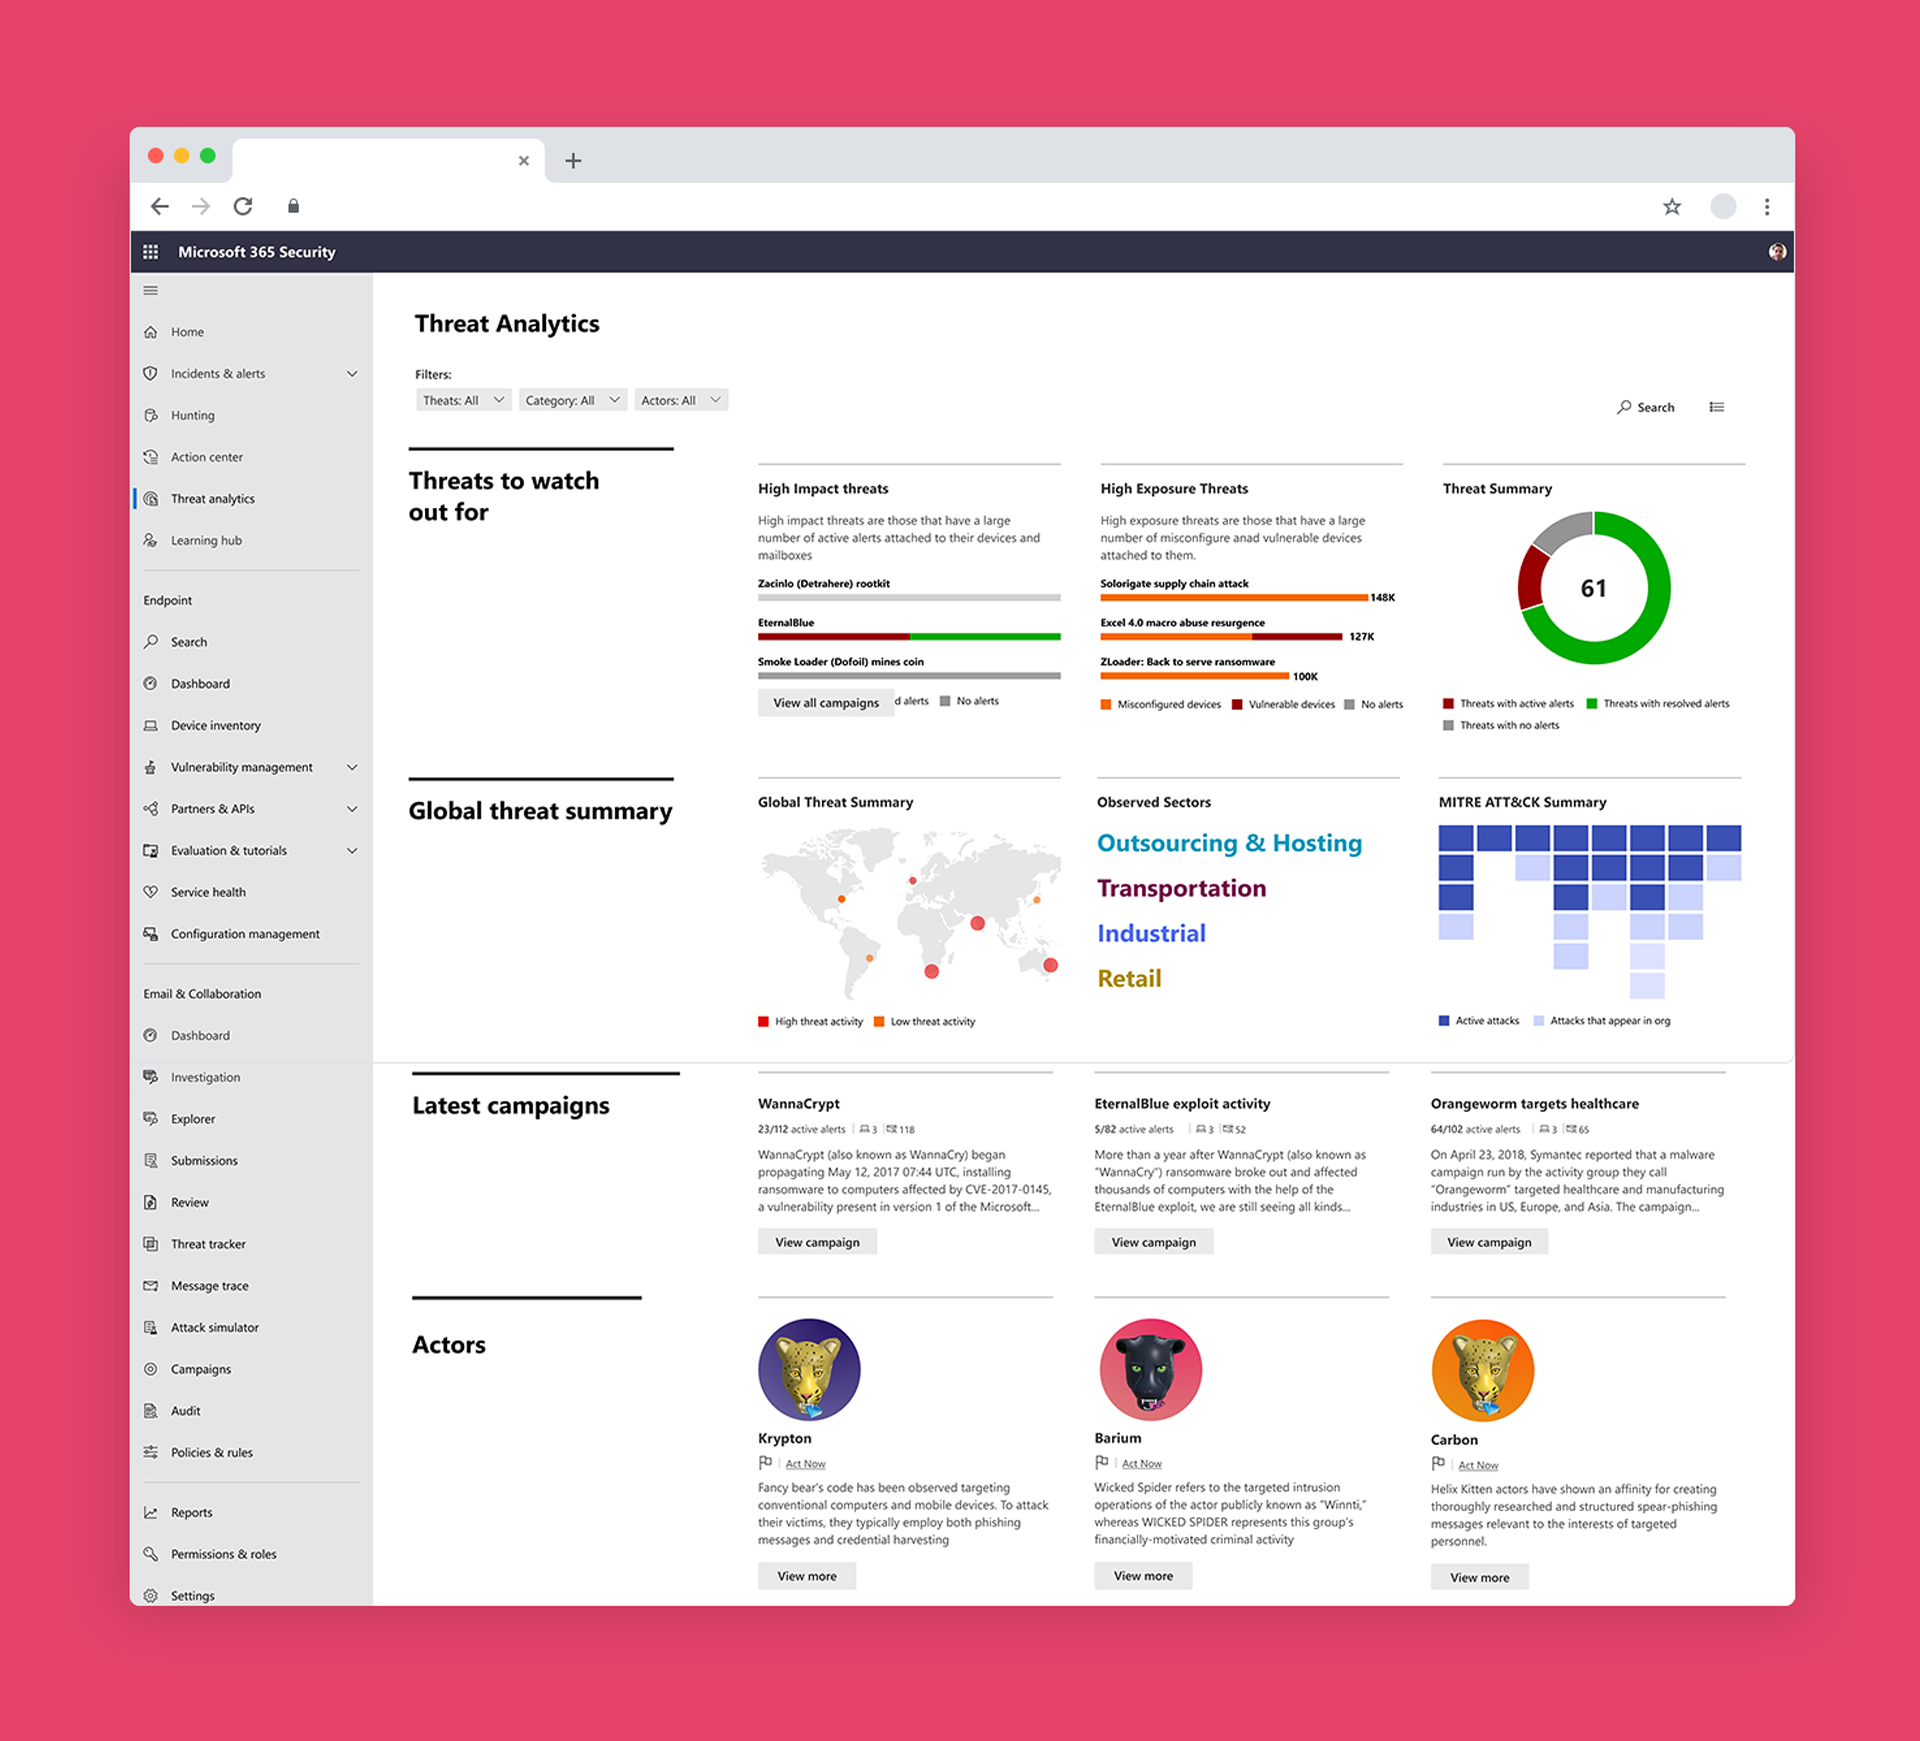
An aggregated Analyst Report
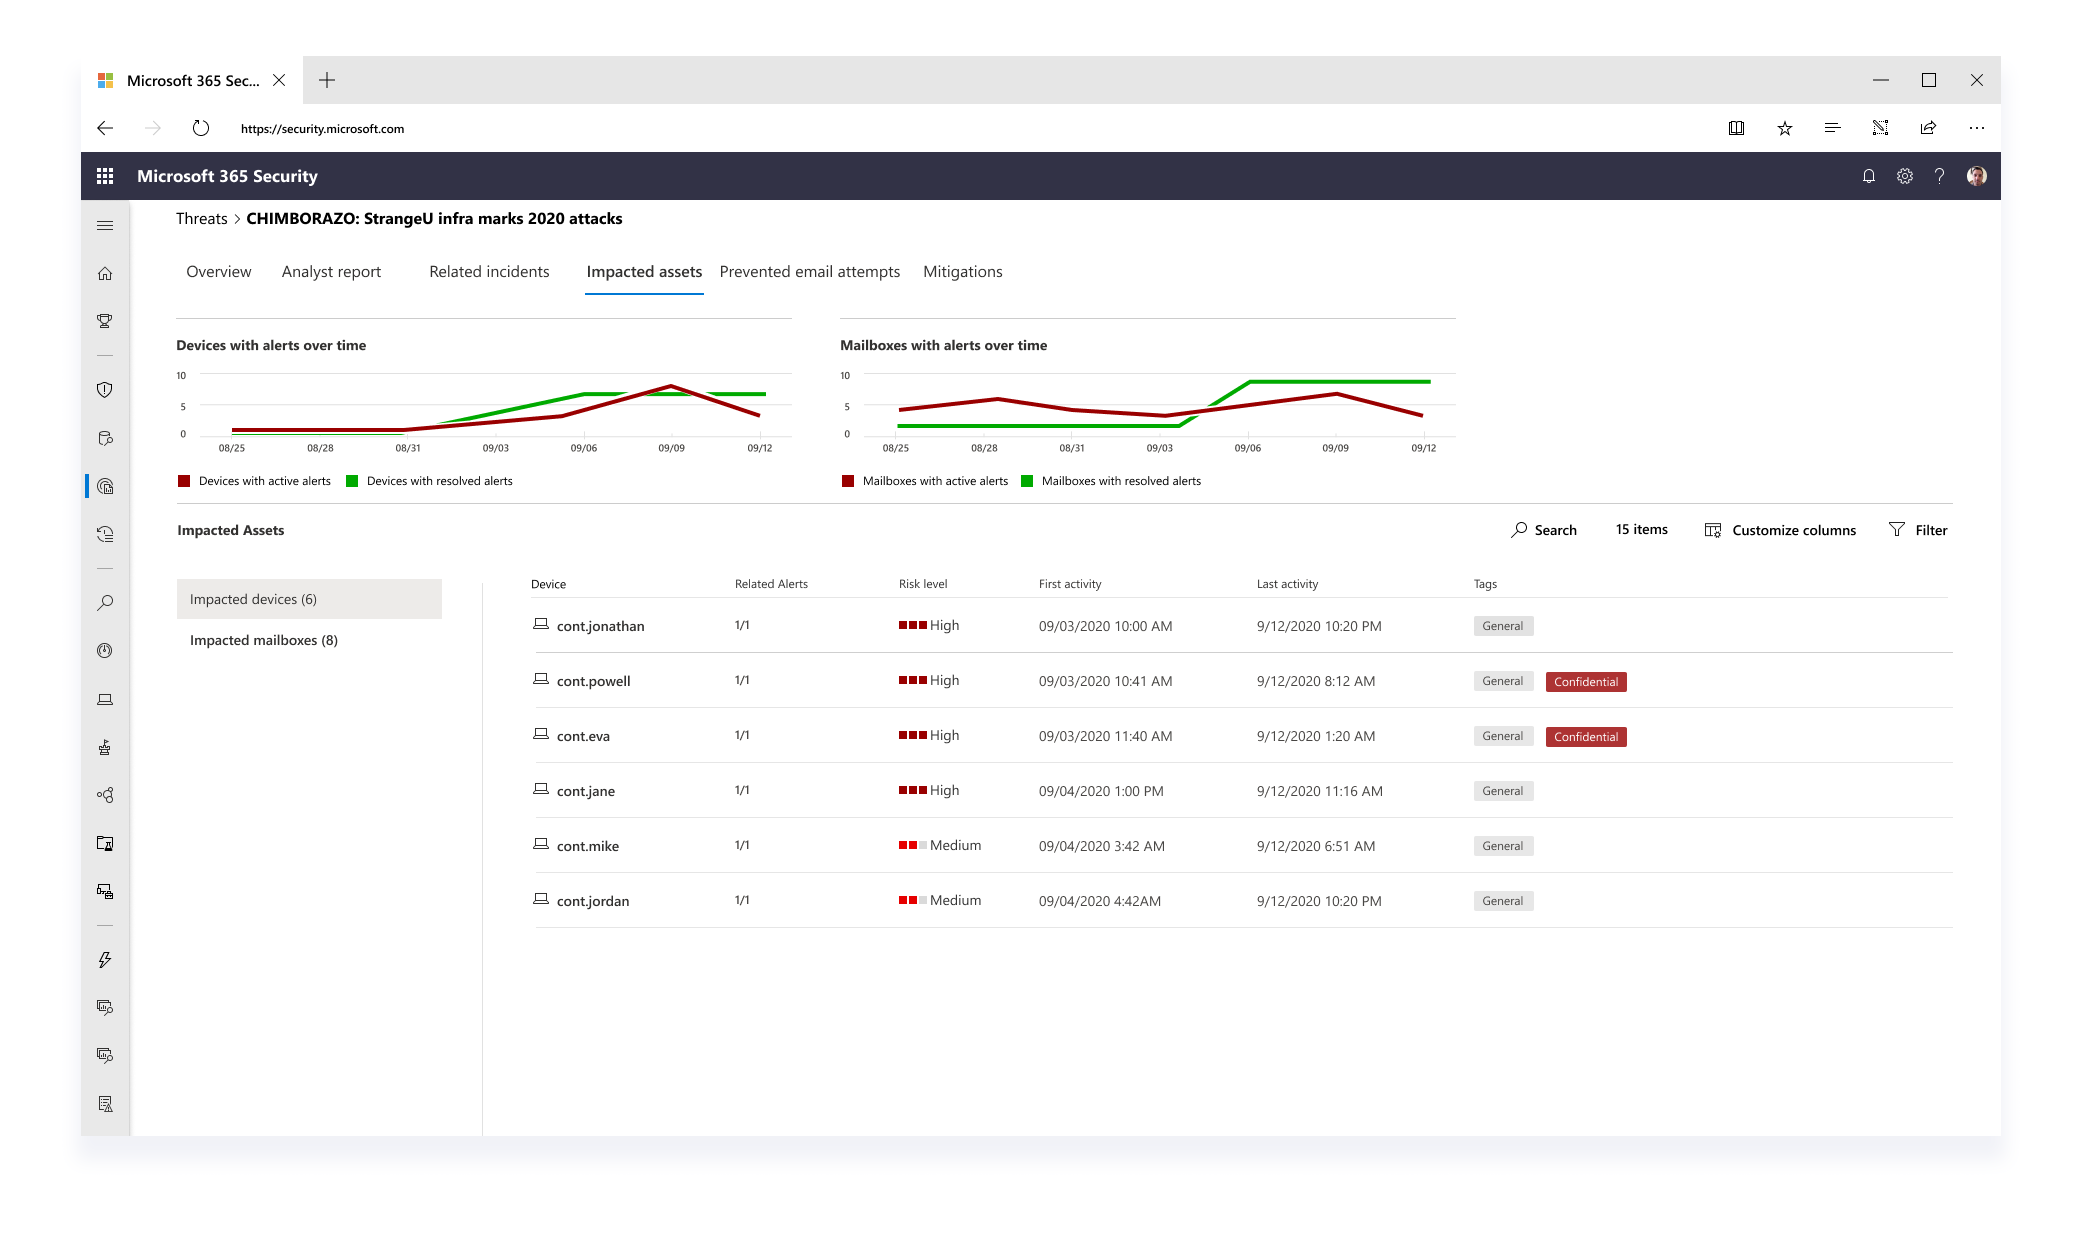
The re-design of for the first phase of threat analytics included an aggregated view of associated risk and vulnerability data associated with the specific threat report. The report now not only included well-documented informative text of the threat, but associated data of incidents, affected assets, and relevant recommendations.
This data is summarized in the overview tab, and detailed out in separate tabs where an analyst can continue their investigation flow in other areas of the product.


User Research
In collaborating with the User Research team, a cohesive study was conducted on 8 security professionals on the changes that were applied to the report. The main findings were:
- Following the threat report design change, the second most commonly used action in threat analytics was drilling down to related incidents from the report which completed the goal of connecting threat analytics to other product areas
![]()
- The most common and dominant action was still reading through the full analyst report with the tendency to look for common indicators and action items to better protect their organization
- Threat analytics and incidents both tell a similar story about an attack, yet the stories are not identical as each area presents information from a different angle using different visualize means


Goals - Phase II
- Expose threat intelligence in a more organized fashion by creating a linked library of actors, campaigns and techniques
- Maintain relationships between different types of entities so that security analysts can automatically draw smart conclusions
- Improve the usability of the analyst report based on user feedback and expose action items from the report in more visible and distinguishable areas

Glimpse of design brainstorm workshop to define Threat Actors
![]() Initial design explorations for Threat Actors
Initial design explorations for Threat Actors
![]()
![]()

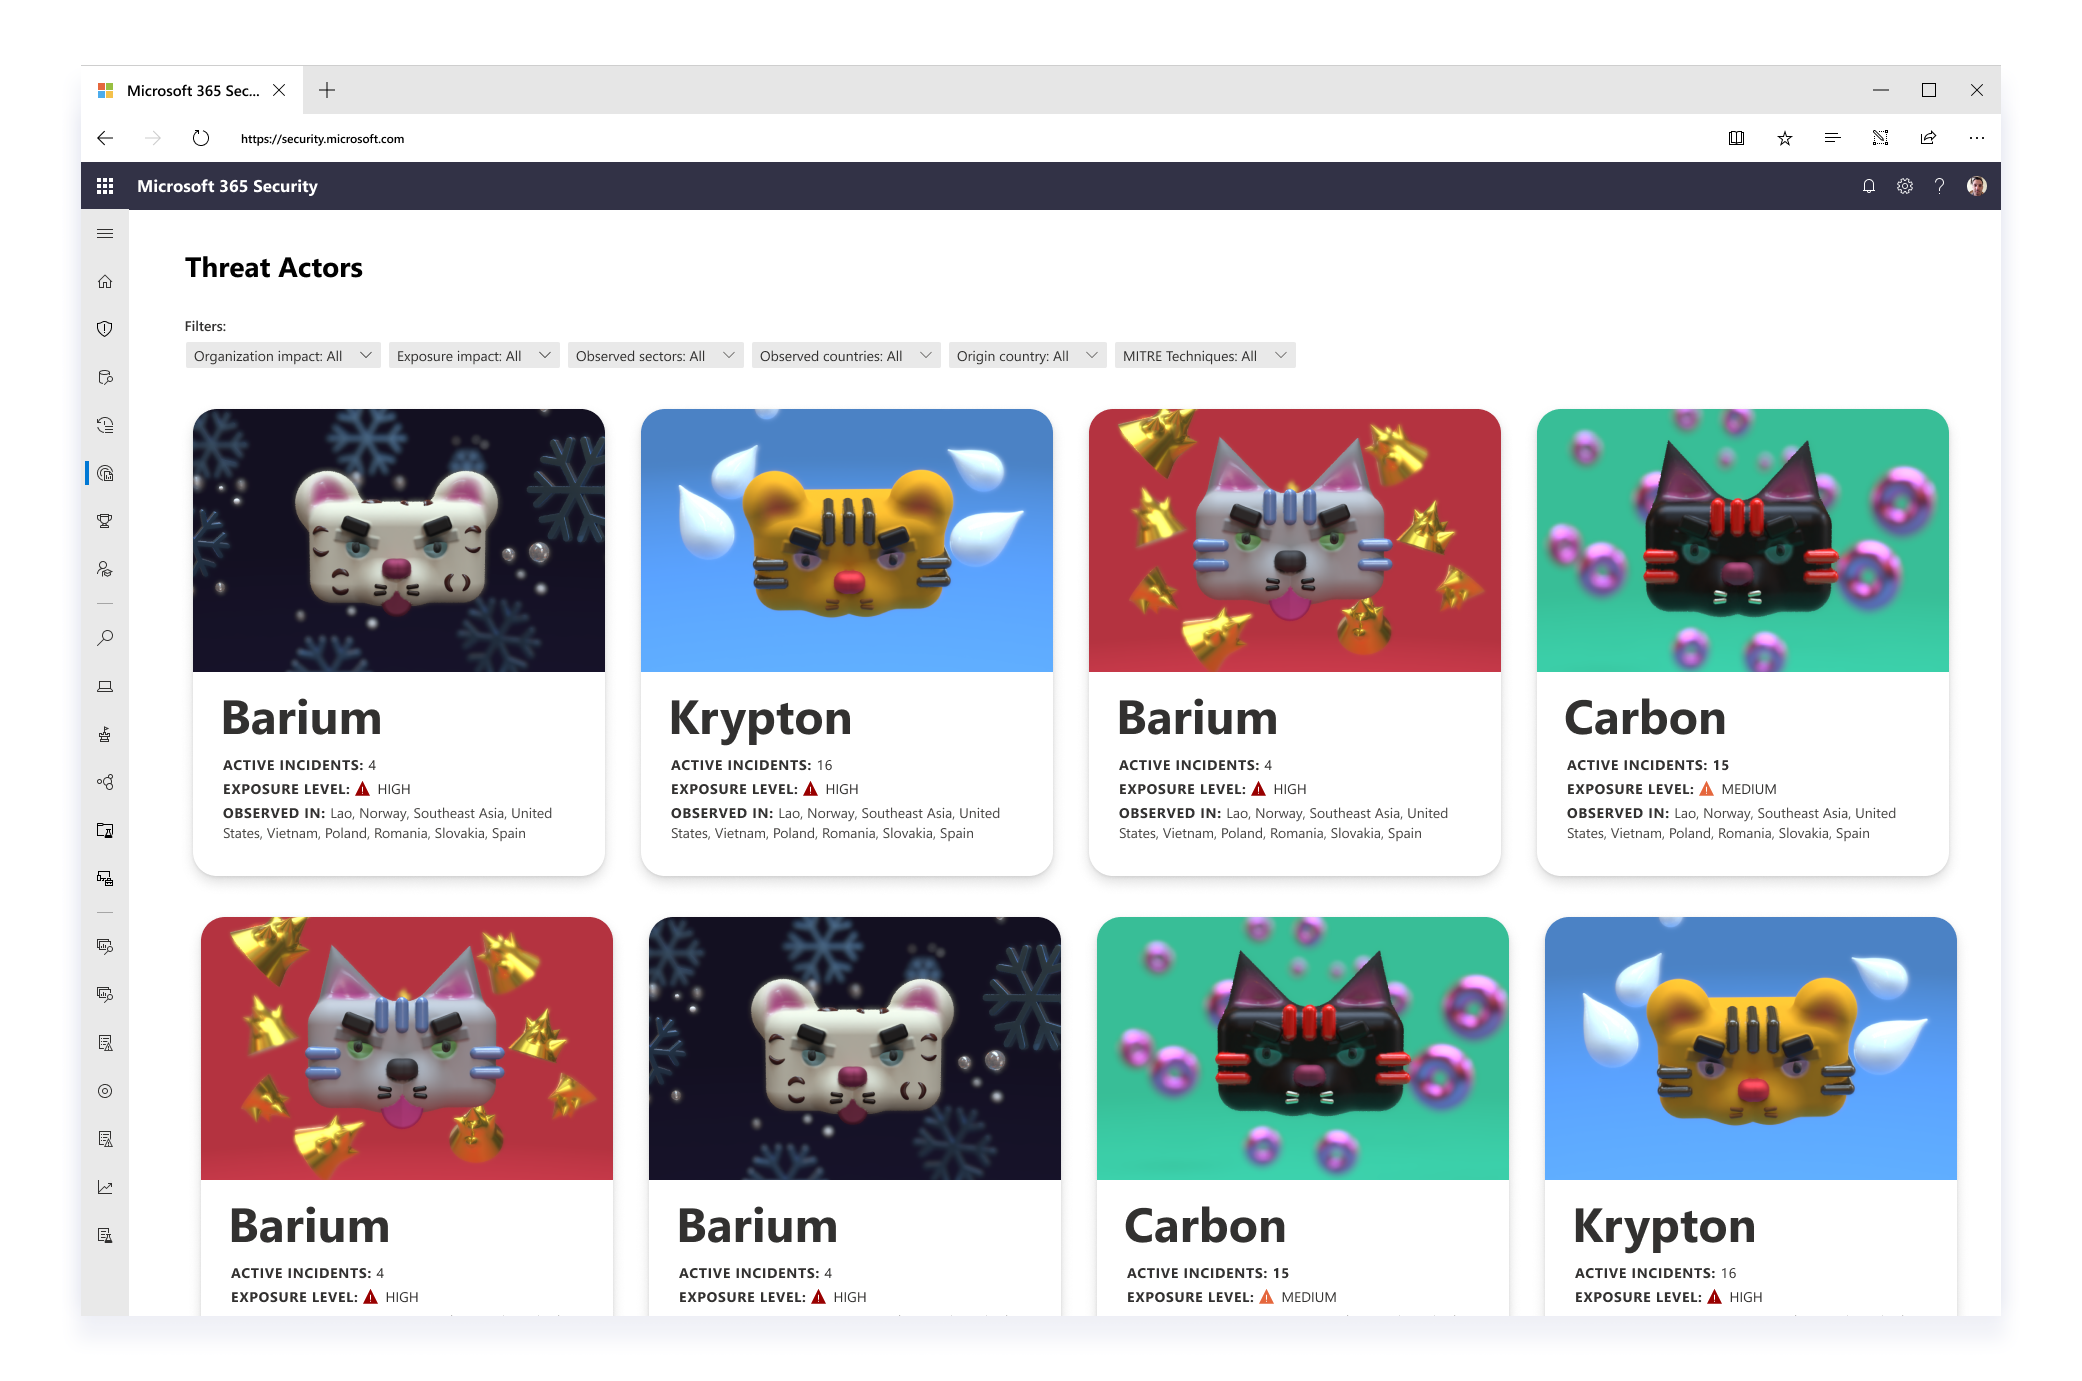

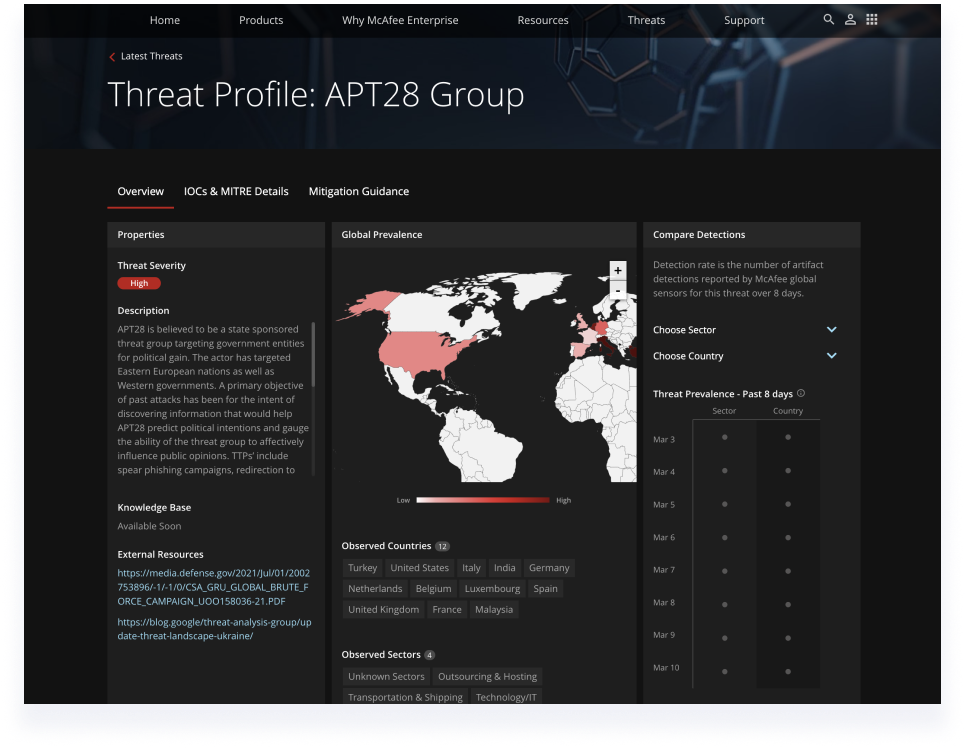
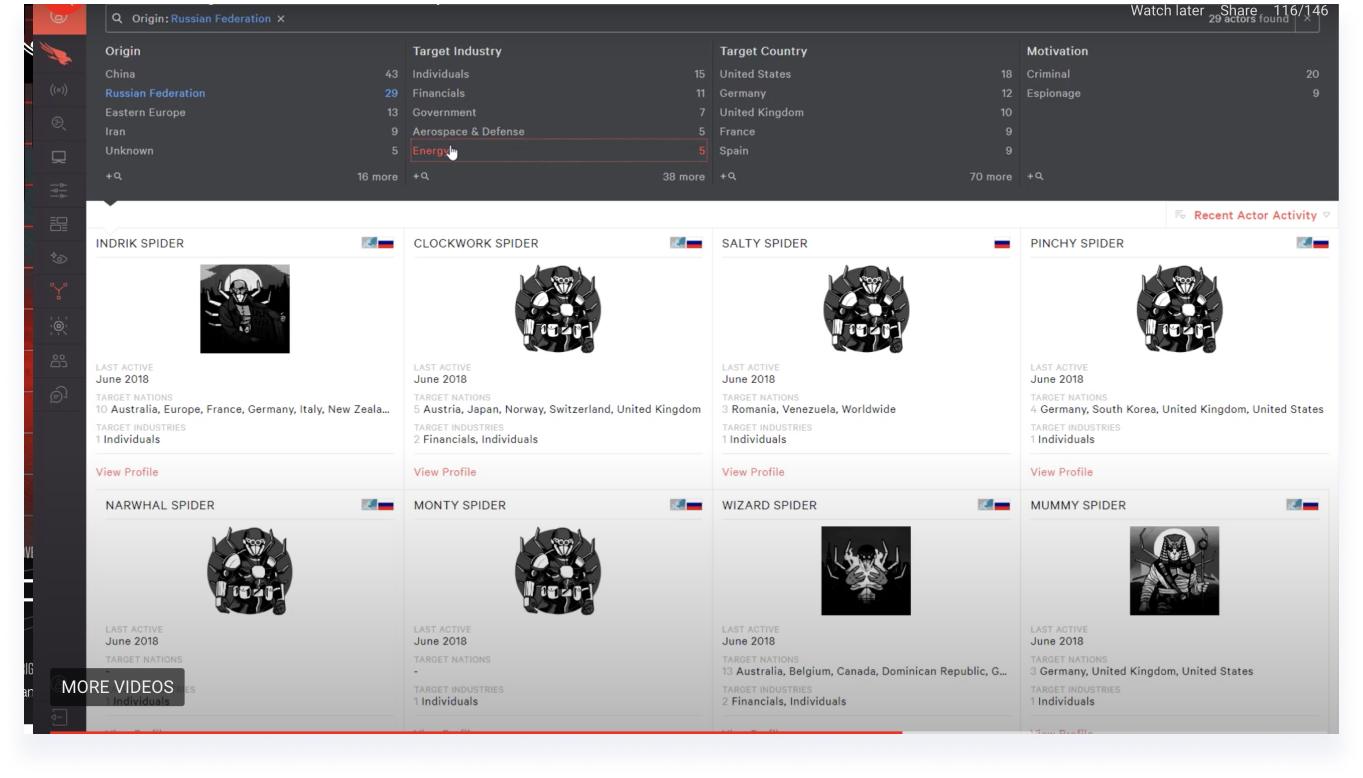
Creating a Threat Intelligence library & Threat Actor profiles
- In creating a unique intelligence library, the re-design included a better fitting layout and look-and-feel
- Threat Actor profiles were introduced with content presenting more global prevelance and related sectors of threats in different fields
- In order to set our product apart from competitors, I set up a brainstorming session with various design and product teams to allow us to identify and isolate M365 Defender’s distinguished characteristics that would make the actor profile illustrations stand out
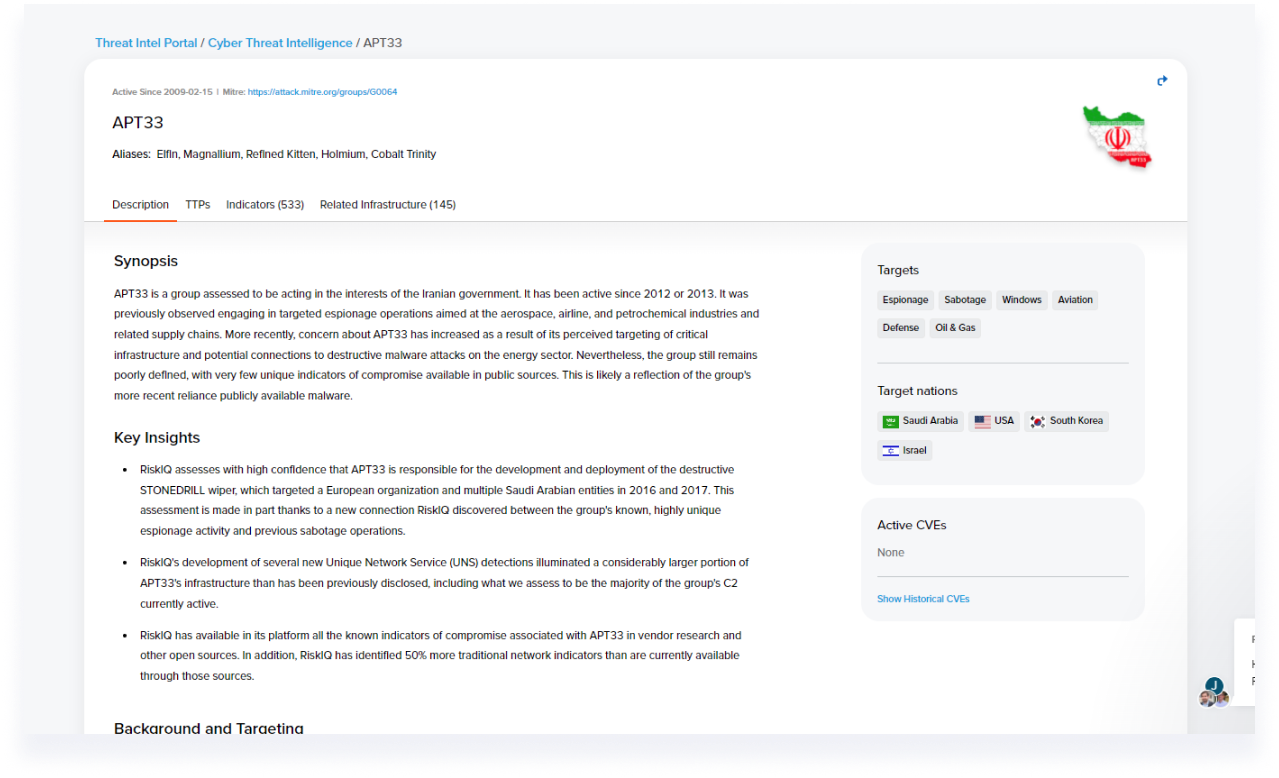
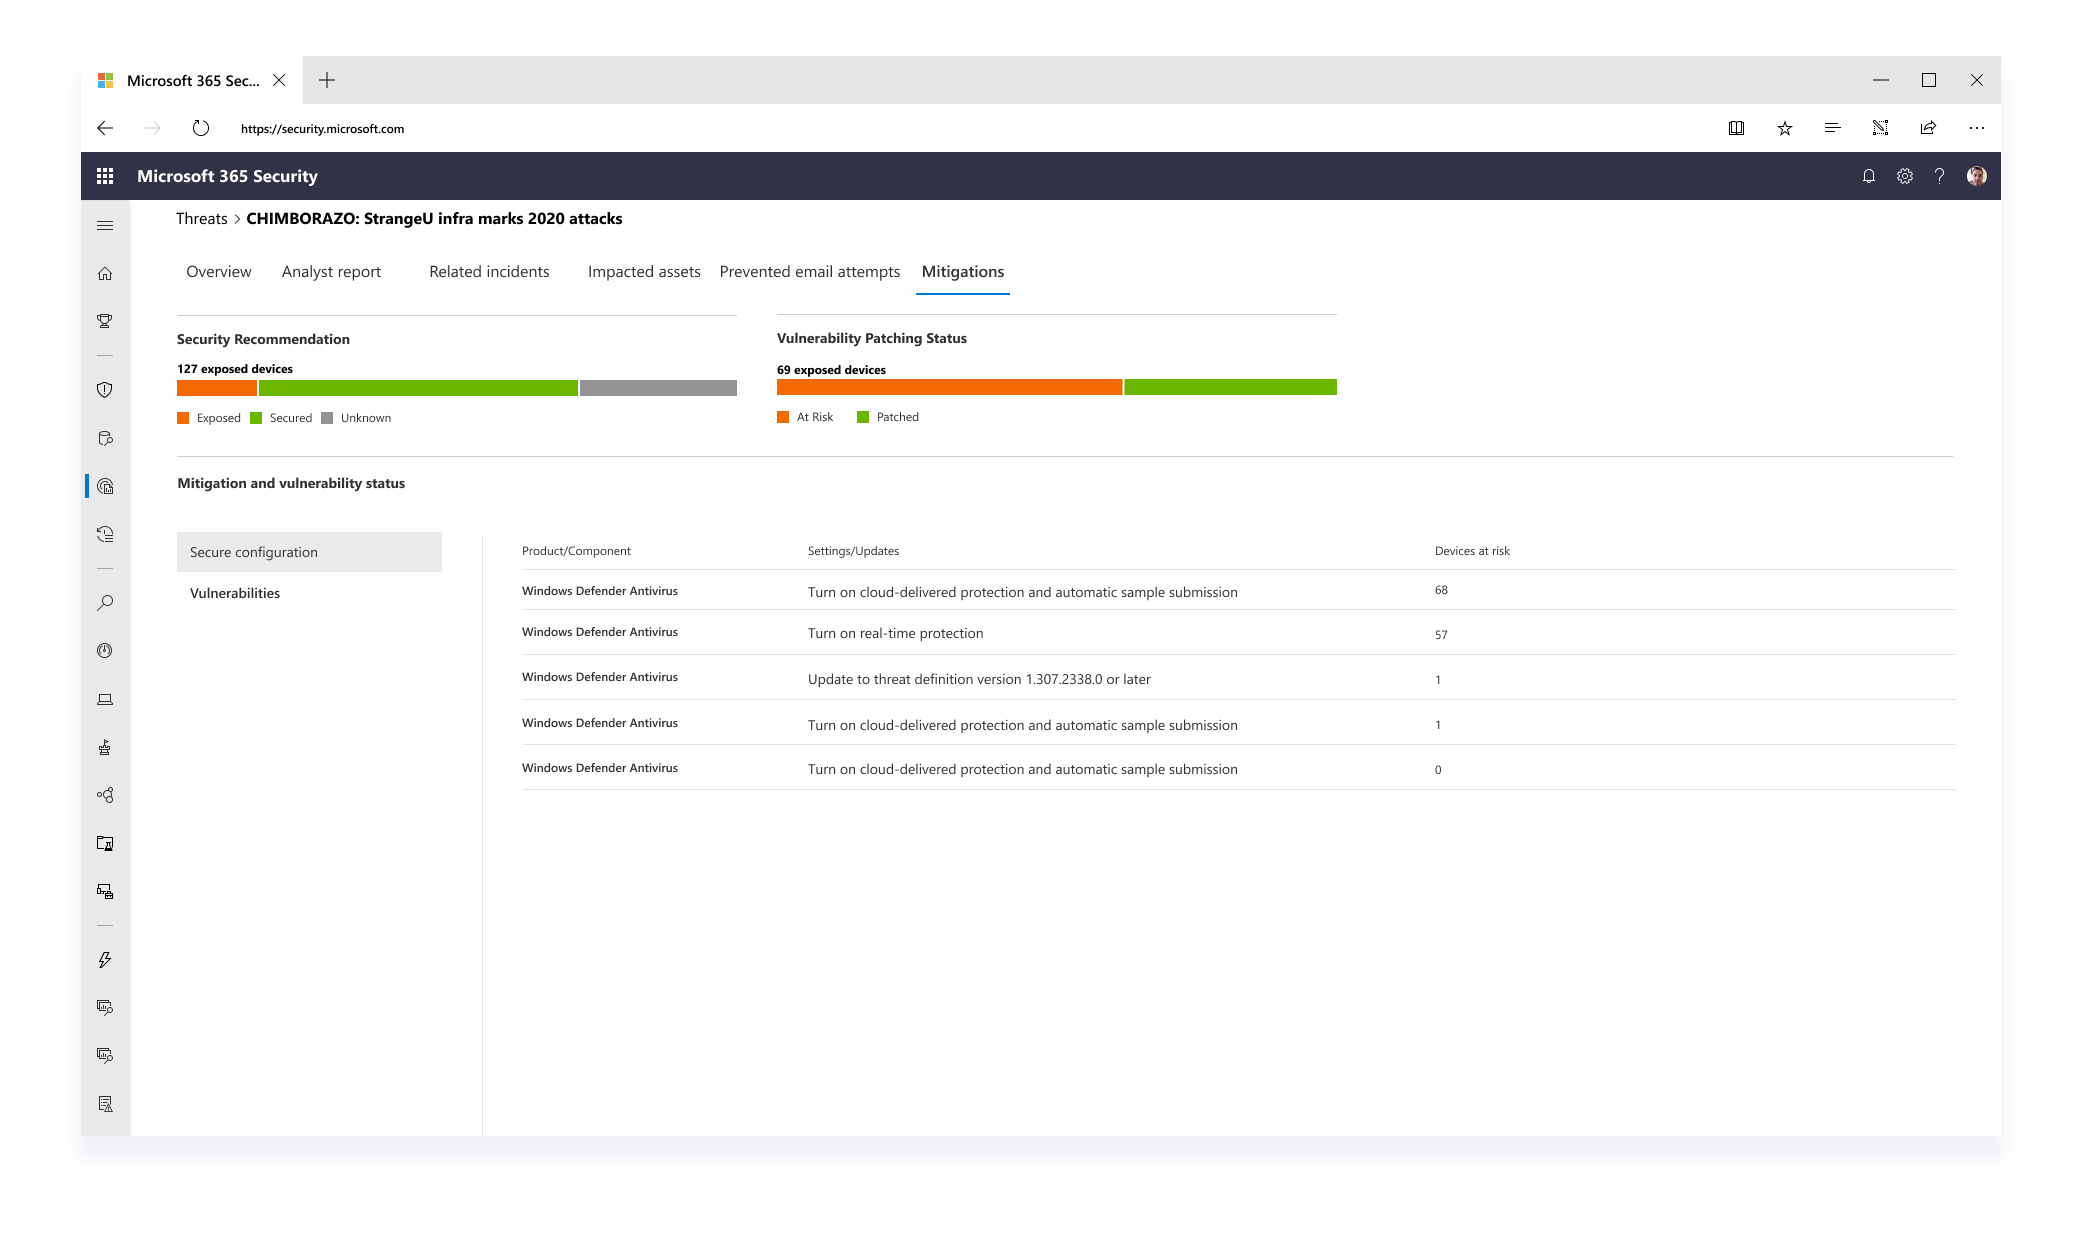
Improving the Analyst Report with a MITRE Technique graph
- Information like attack techniques for a specific threat were exposed in different tabs to tell a more consistent story around investigation
- Instead of textually listing tactics and techniques that were observed for a specific threat campaign, I presented this information in a graph - highlighting impacted techniques as well as techniques of high exposure to risk based on previous attack history
- The graph was further designed and expanded to bring unique value to the user such as posture recommendations for each individual attack technique, providing a well-rounded security overview
- The filtering methods and content of the graph are still being explored in order to give the users the most focused context while providing the best threat intelligence information. Feedback is collected from various teams across the M365D product teams and through from customer conversations I regularly initiate and conduct.
_____________________________________________________________
In Summary
- A wholesome connection between threats and incidents was made using designed emphasis in the UI and the threat reports
- The visual language I created in Threat Analytics separated the product from its competitors
- Threat Analytics became a source of truth of action items for a security professional to take. Based on user feedback I collected, this was no longer just a place to gather and read threat information, but also a valuable starting point for protection.